boxplot python pandas tutorial | pandas boxplot example
In these tutorial Learn Boxplot python pandas with example.Box Plot is the visual representation of depicting the groups of numerical data through quartiles. It is also used for detect the outlier in data set. The python pandas have some plotting capability that you have created a panda dataframe. In this one can directly use box plot function that is part of pandas. It will capture the summary of the data efficiently with a simple box and whiskers. Then it will allow us to compare easily across groups.
Boxplot will summarize sample data using 25th, 50th and 75th percentiles. These percentiles are known as the lower quartile, median and upper quartile. The boxplot is the tool for visualizing distribution of multiple sets of data. Boxplot will show the distribution of the set of data. The boxplot are designed to help you and quickly identify quartile boundaries which is valuable.
A box plot consists of 5 things as follows,
- Minimum
- First Quartile or 25%
- Median (Second Quartile) or 50%
- Third Quartile or 75%
- Maximum
Plot express functions will take first argument a tidy pandas, dataframe.
In box plot created by px.box and distribution of column given as y argument represented.
If data are not available as tidy dataframes you can use go.
Syntax:
seaborn.boxplot(x=None, y=None, hue=None, data=None, order=None, hue_order=None, orient=None, color=None, palette=None, saturation=0.75, width=0.8, dodge=True, fliersize=5, linewidth=None, whis=1.5, notch=False, ax=None, **kwargs)
Parameters:-
x = feature of dataset
y = feature of dataset
hue = feature of dataset
data = datafram or full dataset
color = color name
Python pandas boxplot Example:-
#import the required ibrary
Import numpy as np
Import pandas as pd
Import matplotlib.pyplot as plt
%matplotlib inline
#load the dataset
df=pd.read_csv(“tips.csv”)
#display 5 row of dataset
df.head()
Output:-
Total bill tip day time size
- 16 1 sun dinner 2
- 10 1 sun dinner 3
- 21 3 sun dinner 3
- 23 3 sun dinner 2
- 24 3 sun dinner 4
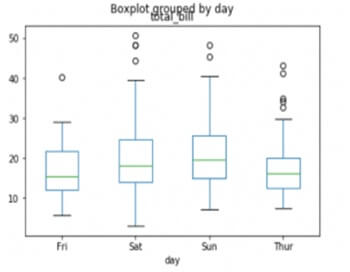
df.boxplot(by=’day’,column=[‘total_bill’],grid=False)
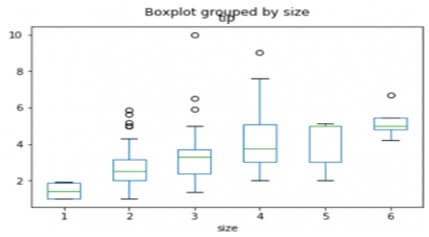
df.boxplot(by=’size’,column=[‘tip’],grid=false)
One way to plot box plot using pandas dataframe is to use boxplot() function that is part of pandas library.