simple linear regression in python
Simple linear regression in python : The linear regression is one of the most important and widely used regression techniques.
If you want to become better statistician a data scientist or machine learning engineer go through linear regression.
They help to wrap head around the subject of regression analysis. It is the simplest regression method and its advantage is the ease of interpreting result.
We will discuss the basic of linear regression and its implementation in Python programming language.
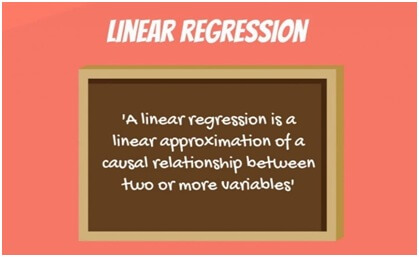
Linear regression is a statistical approach for relationship between a dependent variable with a given set of independent variable.
Features of linear regression are two types of supervised machine learning algorithms of Regression and classification.
The former will predict continuous value output while the latter predict the discrete outputs.
The predicting price of a house in dollars is a regression problem whereas predicting a tumor is a classification problem.
We will study what linear regression is and how it can be implemented for both two variables and multiple variables by using Sicker-Learn.
It is popular machine learning libraries for Python and regression will search for relationships among variables.
Linear models are independent ally and identically distributed for errors with hetroscedasticity.
The module allow the estimation by ordinary least squares (OLS) weighted least squares (WLS) generalize least squares (GLS) and feasible generalize the term “linearity”. If we draw this relationship in a two-dimensional space we get a straight line.
Linear regression will perform the task to predict a dependent variable value (y) and s based on a given independent variable (x).
This regression technique will find out a linear relationship between x (input) and y (output) and called as “linear regression”.
If we plot the independent variable (x) on the x-axis and dependent variable (y) on the y-axis the linear regression will give us a straight line that best fits the data points.
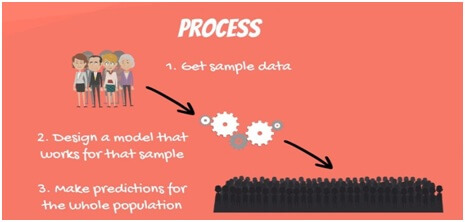
The Process of Creating a Linear Regression :-
The following steps are followed.
- First get sample data.
- Then you can design a model that will explain the data.
- The use of model you have developed to make a prediction for whole population.
simple linear regression example in python 1:-
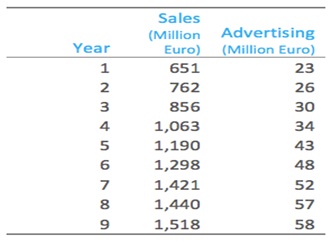
The table shows some data from the early days of the Italian clothing company Benetton. Each row in table shows Benetton’s sales for a year and the amount spent on advertising that year.Our outcome of interest is sales it is what we want to predict.
If we use advertising as the predictor variable, linear regression estimates that Sales = 168 + 23 Advertising.
That is if advertising expenditure is increased by one Euro, then sales will be expected to increase by 23 million Euros and if there was no advertising we would expect sales of 168 million Euro.
linear regressionOutput:-
simple linear regression example in python 2:-
Explanation:-
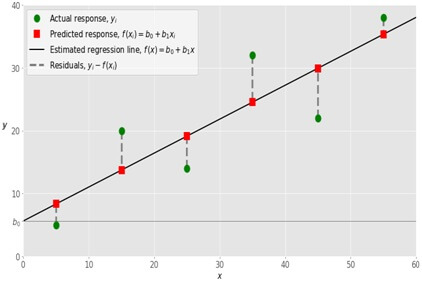
While implementing a simple linear regression you start with a given set of input output (𝑥-𝑦) pairs (green circles).
The leftmost observation (green circle) has the input 𝑥 = 5 and actual output (response) 𝑦 = 5.
The next one has 𝑥 = 15 and 𝑦 = 20, and so on.
The regression function has the equation as (𝑥) = 𝑏₀ + 𝑏₁𝑥.
Our goal is to calculate the optimal values of the predicted weights 𝑏₀ and 𝑏₁ that will minimize SSR and determine the estimated regression function.
The value of 𝑏₀ is called as intercept and will show the point where the estimated regression line crosses the 𝑦 axis.
The value of the estimated response (𝑥) for 𝑥 = 0 and the value of 𝑏₁ will determine the slope of the estimated regression line.
The predicted response (red squares) are the points on the regression line and that will correspond to input values.
For the input 𝑥 = 5 the predicted response is (5) = 8.33 (represented with the leftmost red square).
The residuals (vertical dashed gray lines) can be calculated as 𝑦ᵢ - (𝐱ᵢ) = 𝑦ᵢ - 𝑏₀ - 𝑏₁𝑥ᵢ for 𝑖 = 1, 𝑛.
They are the distances between the green circles and red squares.
If you are trying to minimize distance and make the red squares as close to the predefined green circles as possible.
There are two kinds of variables in a linear regression model as follows:-
- The input variable is the variable(s) that help predict the value of the output variable and referred to as X.
- The output variable is the variable that we want to predict and commonly referred to as Y.
To estimate Y using linear regression,
Yₑ = α + β X
Where Yₑ is the estimated value of Y and based on our linear equation.
We need to find statistically significant values of the parameters α and β that minimize the difference between Y and Yₑ.
To determine the optimum values of these two parameters we will have the line of best fit that can use to predict the values of Y given the value of X.
We can use a method called ordinary least squares.
linear regression Advantages:
- The liner regression is simple method and easy to use and understand.
- The person with school knowledge of mathematics can understand and use it.
- It works in most of cases even if it fit the data exactly and finds relation between two variables.
linear regression Disadvantage:
- Depending on definition of linear regression the relationship between dependent and independent are linear.
- Linear regression is sensitive to anomalies in data.
- Most of data in range 0-10any reason influence regression coefficient.
- If we have a number of parameters than number of samples available then model start the noise than relationship between variables.


