Meshgrid python tutorial with example
The meshgrid python function us useful for creating the coordinates to vectorize function. The numpy users will have notice discrepancy between the meshgrid and meshgrid. Discrepancy exists when there should be one and only one obliviously what to do. The meshgrid function will create some kind of coordinates for plotting and see direct benefit of it. The python machine learning and he is using for plotting decision borders. The numpy meshgrid function is used to create a rectangular grid or the matrix indexing. The function is used to create a rectangular grid in which two one dimensional array representing Cartesian indexing or matrix indexing. The numpy.meshgrid function is used to create rectangular grid out of two arrays. For any line parallel to x axis the coordinates of the marked points are -4,-3,-2,-1, 0, 1,2,3,4.
The meshgrid function is totally inspired by the MATLAB.
Parameters: |
1-D arrays representing the coordinates of a grid. |
Returns: |
For vectors x1, x2, ‘xn’ with lengths Ni=len (xi), return (N1, N2, N3, Nn) shaped arrays if indexing=’ij’ or (N2, N1, N3, Nn). |
Python meshgrid Example:-
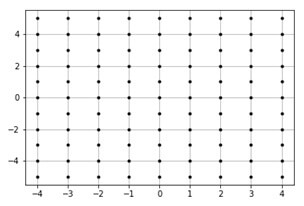
Consider the figure below with X-axis ranging from -4 to 4 and Y-axis from -5 to 5.
There are a total of (9 * 11) = 99 points marked in the figure.
In this each point with an X-coordinate and a Y-coordinate.
For any line parallel to the X-axis, the X-coordinates of the marked points are -4, -3, -2, -1, 0, 1, 2, 3, 4.
For any line parallel to the Y-axis, the Y-coordinates of the marked points from bottom to top are -5, -4, -3, -2, -1, 0, 1, 2, 3, 4, 5.
The numpy.meshgrid function will returns two 2-Dimensional arrays representing the X and Y coordinates of all points.
Output:-
Example:-
#sample code for generation of first example
Import numpy as np
#from matplotlib import pyplot as plt
#pyplot imported for plotting graphs
X=np.linespace (-4, 4, 9)
#numpy.linespace creates an array of
#9 linearly placed elements between
#-4 snd 4, both inclusive
Y=np.linespace (-5, 5, 11)
#the meshgrid function returns
#two dimensional arrays
X_1, y_1=np.meshgrid(x,y)
Print(“x_1=”)
Print(x_1)
Print(“y_1=”)
Print(y_1)
Output:-
x_1= [[-4.-3.-2.-1.0.1.2.3.4.]]
[-4.-3.-2.-1.0.1.2.3.4.]
[-4.-3.-2.-1.0.1.2.3.4.]
[-4.-3.-2.-1.0.1.2.3.4.]
[-4.-3.-2.-1.0.1.2.3.4.]
[-4.-3.-2.-1.0.1.2.3.4.]
[-4.-3.-2.-1.0.1.2.3.4.]
[-4.-3.-2.-1.0.1.2.3.4.]
[-4.-3.-2.-1.0.1.2.3.4.]
[-4.-3.-2.-1.0.1.2.3.4.]
[-4.-3.-2.-1.0.1.2.3.4.]]
y_1= [ [-5.-5.-5.-5.-5.-5.-5.-5.-5.]
[-4.-4.-4.-4.-4.-4.-4.-4.-4]
[-3.-3.-3.-3.-3.-3.-3.-3.-3.]
[-2.-2.-2.-2.-2.-2.-2.-2.-2.]
[-1.-1.-1.-1.-1.-1.-1.-1.-1.]
[0.0.0.0.0.0.0.0.0.]
[1.1.1.1.1.1.1.1.1.]
[2.2.2.2.2.2.2.2.2.]
[3.3.3.3.3.3.3.3.3.]
[4.4.4.4.4.4.4.4.4.]
[5.5.5.5.5.5.5.5.5.]]
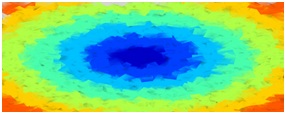
The output of coordinates can also used for plotting functions within the coordinate range.
The purpose of the meshgrid function is to create a rectangular grid out of an array of x values and an array of y values.
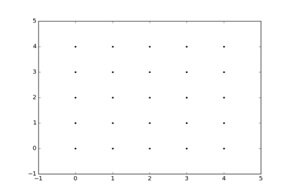
Suppose you want to create grid where you have point at each integer value between 0 and 4 in x and y direction.
To create the rectangular grid you need every combination of x and y points.
The points will be 25 so you wanted to create the x and y arrays for all points as follows,
Example:-
X [0, 0] =0 y [0, 1] =0X [0, 1] =1 y [0, 2] =0
X [0, 2] =2 y [0, 3] =0
X [0, 3] =3 y [0, 4] =0
X [0, 4] =4 y [0, 5] =0
X [1, 0] =0 y [1, 0] =1
X [1, 1] =0 y [1, 1] =1
X [1, 2] =0 y [1, 2] =1
X [1, 3] =0 y [1, 3] =1
X [1, 4] =0 y [1, 4] =1
X [2, 0] =0 y [2, 0] =2
X [2, 1] =0 y [2, 1] =2
X [2, 2] =0 y [2, 2] =2
X [2, 3] =0 y [2, 3] =2
X [2, 4] =0 y [2, 4] =2
X [3, 0] =0 y [3, 0] =3
X [3, 1] =0 y [3, 1] =3
X [3, 2] =0 y [3, 2] =3
X [3, 3] =0 y [3, 3] =3
X [3, 4] =0 y [3, 4] =3
X [4, 0] =0 y [4, 0] =4
X [4, 1] =0 y [4, 1] =4
X [4, 2] =0 y [4, 2] =4
X [4, 3] =0 y [4, 3] =4
X [4, 4] =0 y [4, 4] =4
The result is the matrix of x and y matrices pairing the elements in each matrix that gives x and y coordinates of point in grid.
X= 0 1 2 3 4 y= 0 0 0 0 0
0 1 2 3 4 1 1 1 1 1
0 1 2 3 4 2 2 2 2 2
0 1 2 3 4 3 3 3 3 3
0 1 2 3 4 4 4 4 4 4
You can then plot these to verify that they are a grid
It is very difficult for large range of x and y.
Meshgrid can create this for and you have to specify the unique x and y values.
Xvalues=np.array ([0, 1, 2, 3, 4]);
Yvalues=np.array ([0, 1, 2, 3, 4]);
After calling meshgrid you will get the previous output.
Example:-
Plt.plot (x, y, marker=’.’, color=’k’,linestyle=’none’)
Example:-
Xx, yy=np.meshgrid (xvalues, yvalues)
plt.plot(xx,yy,marker=’.’,color=’k’,linestyle=’none’)
Output:-