Pandas dataframe tutorial | Python dataframe tutorial
pandas dataframe tutorial : In these python dataframe tutorial learn Creating a dataframe, Dealing with rows and columns, Indexing and selecting data. Python are in school system, economics dataframe, shop or ecommerce dataframe. In this tutorial we are going to discuss the data processing with pandas.
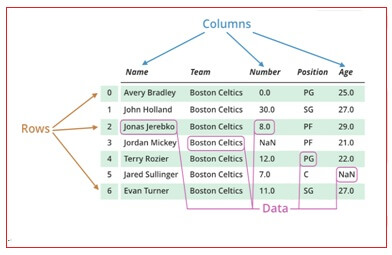
The data frame is tabular data with rows and columns. It is the two dimensional array with the labeled axes (rows and column). It is the standard way to store the data. The rows and column are used to name the information.
The operations performed on pandas are:-
- Creating a dataframe
- Dealing with rows and columns
- Indexing and selecting data
- Working with missing data
- Iterating over rows and the columns. of python are in school system, economics dataframe,shop or ecommerce dataframe
Example:-
The number of student is name if the “table” and 10 is the “actual value”.
The fig below shows example of dataframe.
Creating the data frame :-
The use of dataframe is to convert panda’s dataframe into library. In the real world pandas data frames are created by loading the datasets from existing storage. The storage can be sql database, csv and excel file. Dataframe can be created by list, dist, and list of disc it is done by np.array(). Numpy is converted to data frames with pd.dataframe (). The pandas are the open source library that allows you to perform data manipulation in python. Pandas library is built on top of Numpy, means that Pandas needs Numpy to operate. Pandas will provide easy way to create and manipulate the data. Pandas are also a solution for time series data. The python library is thing that makes python a great programming language for analysis. It builds like numpy and matplotlib to give a single, convenient place to do analysis and visualization.
Features of Data Frame :-
- The columns are of different types.
- Size is Mutable.
- Labeled axes (rows and columns).
- Can Perform Arithmetic operations on rows and columns.
A pandas Data Frame can be created using the constructor as follows:-
pandas.DataFrame (data, index, columns, dtype, copy).
The parameters of the constructor are as follows:-
Sr.No |
Parameter & Description |
1 |
data |
2 |
index |
3 |
columns |
4 |
dtype |
5 |
copy |
The data can be created in the following ways as follows:-
Create an Empty Data Frame :-
Firstly the empty Data Frame can be created.
The example is given as below,
Example:-
Import pandas as pd
df=pd.DataFrame()
printdf
Output:-
Empty DataFrame
Columns: []
Index: []
Create a Data Frame from Lists :-
The Data Frame can be created using a single list or a list of lists.
The example is as follows,
Example:-
Import pandas as pd
Data= [[‘Asmita’, 20], [‘Arti’, 10]
df=pd.DtaFrame(data.columns=[‘Name’,’house no’])
print df
Output:-
Name Age
0 Asmita 20
1 Arti 10
The “dtype” parameter changes the type of Age column to floating point.
Create a DataFrame from Dict of ndarrays / Lists :-
All the ndarrays must be of same length.
If the index is passed, then length of index should be equal to the length of arrays.
And if not passed, then index will be in range of (n) where n is the array length.
Example:-
Import pandas as pd
Data={‘city’:[‘pune’,’satara’,’sangli’,’kolhapur’,’miraj’],’pin’:[2,3,4,5,6]}
df=pd.Dataframe(data)
Print df
Output:-
Pin city
0 2 pune
1 3 satara
2 4 sangli
3 5 kolhapur
4 6 miraj
Create a Data Frame from List of Dictionaries :-
The List of Dictionaries can be passed as input data to create the Data Frame.
Dictionary keys are by default taken as column names.
The following example shows how to create a Data Frame by passing list of dictionaries.
Example:-
Import pandas as pd
Data= [{‘a’:11,’b’:12}, {‘a’:12,’b’:33,’z’:40}]
df=pd.DataFrame(data)
print df
Output:-
a b z
0 11 12 NaN
1 12 33 40.0
Creates indexes DataFrame using array :-
The following example gives the explanation o the dataframe using array.Example:-
Import pandas as pd
Data={‘name’:[‘samiksha’,’jack’,’swati’,’nick’,’yogi’],’salary’:[11000,22000,3000,55000,3000]}
Df=pd.DataFrame(data,index=[‘sal1’,’sal2’,’sal3’,’sal4’,’sal5’])
Print df
Output:-
Name salary
0 sal1 samiksha 11000
1 sal2 jack 22000
2 sal3 swati 3000
3 sal4 nick 55000
4 sal5 yogi 30000
Creating DataFrame using zip () function :-
Two list can be used to mergewith each other by using the zip () function.
Create the pandas dataframe by calling the pd.DataFrame() function.
The program below explains the zip() function,
Example:-
Import panda as pd
Name= [‘nick’,’sam’]
Age= [25, 40]
List_of_tuples=list (name,age)
List_of_tuples
Df=pd.DataFrame(list_of_tuples coloumns=[‘name’,’age’])
print df
Output:-
Name age
0 nick 25
1 sam 40
Column Addition in datatframe :-
Python language is used for doing data analysis because of fantastic ecosystem.
Pandas give lot of features to achieve task of addition and deletion.
It will provide support to skip the missing value of the dataframe while calculating sum in the dataframe
We declare the list and column and add row and column to existing dataframe.
It is package that makes importing and analyzing data much easier.
If the input is index then it will add all values and will repeat the same of all columns.
.
Parameters:-
The parameters of the column addition are axis, skipna, level, numeric_only, min_count, returns_only.
Example:-
Import pandas as pd
Data={‘name’:[‘sayli’,’sonu’,’prince’,’anuja’,’seema’],’standard’:[4,5,6,3,6],’city’:[‘katraj’,’sangli’,’kolhapur’,’vita’,’nagar’]}
df=pd.DataFrame(data)
rollno=[1,3,5,7,8]
df[‘rollno’]=rollno
print (df)
Output:-
Name standard city rollno
- Sayli 4 katraj 1
- Sonu 5 sangli 3
- Prince 6 kolhapur 5
- Anuja 3 vita 7
- Seema 6 nagar 8
Row Addition in dataframe:-
DataFrame is a two-dimensional data structure, it means that data is aligned in a tabular fashion in rows and columns.We can create a DataFrame using list, dict, series and another DataFrame.
If we want to add a new row to an already created DataFrame, it is achieved through in-built method like append which will add it to the end of DataFrame.
We will find ways to add the new row DataFrame at the top of the DataFrame using some tricks involving the index of the elements in the DataFrame.
Example:-
Create new dataframe as shown below,
Import pandas as pd
Data= {‘bank’: [‘Axis’,’Sbi’,’Union’],’account’: [‘saving’,’current’,’saving’]}
df=pd.DataFrame(data)
df.iloc[0]=[‘boi’,’saving’]
print df
Output:-
The result is as follows:-
Bank account
0 Axis saving
1 Sbi current
2 Union saving
Deletion of column from data frame :-
Pandas provide the data analysis to delete and filter the data by using .drop () method.
In data analysis the row and column can be removed using the index or column name using the method.
To delete the column in pandas data frame we use drop (), del () and .pop () method.
Column is deleted by dropping column with the column name.
- Create Dataframe
- drop a row or observation
- Drop a row or observation by condition
- Drop a row or observation by index
- Drop the row by position
Parameters are:-
The parameters are as labels, axis, index or column, level, inplace, errors and return type.
Example:-
Import pandas as pd
data= {‘bank’:[‘Axis’,’Sbi’,’Union’],’account’:[‘saving’,’current’,’saving’]}
df=pd.DataFrame(data)
df.drop(df.columns[1],axis=0)
print df
Output:-
srno Bank
0 axis
- sbi
- union
The output is generated by deleting the column of the account.
Changes are made in original data frame since in place which was true.
Deletion of row from by index data frame:-
The drop () remove the rows based on labels than numeric indexing.
To delete rows and numeric position to reassign the dataframe values.
The drop () function in pandas can be used to delete rows from data frame.
Example:-
Import pandas as pd
data= {‘bank’:[‘Axis’,’Sbi’,’Union’],’account’:[‘saving’,’current’,’saving’]}
df.drop([0,1])
print df
Output:-
Bank account
1 Union saving
The code will drop first and second row and the result of dataframe will be as above.
Drop a row or observation by condition:-
We are going to discuss several approaches on how to drop rows from the dataframe based on certain condition applied on a column.
Retain all those rows for which the applied condition on the given column evaluates to True.
Example:-
Import pandas as pd
Data={‘name’:[‘sayli’,’sonu’,’prince’,’anuja’,’seema’],’standard’:[4,5,6,3,6],’city’:[‘katraj’,’sangli’,’kolhapur’,’vita’,’nagar’]}
df=pd.DataFrame(data)
rollno=[1,3,5,7,8]
df[df.Name!=’sonu’]
print (df)
Output:-
Name standard city rollno
0 Sayali 4 katraj 1
1 Prince 6 Kolhapur 5
The output of the above is displayed by deletion of the row by the name sonu.
Drop the row by position/index:-
Now drop the row by position in this the position is recognized and deleted as shown in example shown below,
Example:-
Import pandas as pd
Data={‘name’:[‘sayli’,’sonu’,’prince’,’anuja’,’seema’],’standard’:[4,5,6,3,6],’city’:[‘katraj’,’sangli’,’kolhapur’,’vita’,’nagar’]}
df=pd.DataFrame(data)
rollno=[1,3,5,7,8]
df[:-2]
print (df)
Output:-
Name standard city rollno
0 Sayli 4 katraj 1
1 Sonu 5 sangli 3
2 Prince 6 kolhapur 5
4 Seema 6 nagar 8
The botton of the 3rd row is deleted and result is displayed.


