Non parametric test tutorial with exampl
Non parametric test tutorial with example : The study is represented in a good manner by media and has a small size of the sample. The method does not assume a specific distribution to the data this test will be used to confirm skill between the ML. The test statistics will return a p-value that can be used in to interpret the result of the test. The p-value can be used to the context of significance level called alpha. This will reject different distributions. alpha: It fails to reject the same distribution.
Test data:-
The randn () Numpy function will generate the sample if Gaussian numbers and the standard deviation.
The samples are drawn from the different and small sizes of the per sample and add noise to the decision.
Example:-
from numpy.randiom import seed
from numpy.random import seed
from numpy.random import randn
from numpy.import mean
from numpy.import std
seed (1)
data1=5*randn (100) +50
data1=5*randn (100) +51
print(‘data1: mean=%3f stdv=%3’ %( mean (data1), std (data1)))
print(‘data1: mean=%3f stdv=%3’ %( mean (data2), std (data2)))
data1: mean-50.3 stdv=4.4
data2: mean=51.7stdv=4.6
2.1 Kolmogorov-Smirnov Test for two samples:-
One sample, as well as the two samples, can be accessed in single-page output.
In Kolmogorov, you can select one variable and perform on each of the variables.
The Kolmogorov test is also called as the” non parametric test” and used to compare two samples.
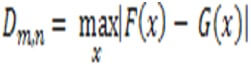
The Kolmogorov has a distance between the sample and the cumulative distribution function.
The name is Andrey Kolmogorov and the Nikolai Smiranov.
The K-S is one of the useful and nonparametric methods for comparing samples.
Syntax:-
ks.scipy.stats.kstest (a, b)
Where a, b are the two distributions.
Parameters:-
Statistics:- |
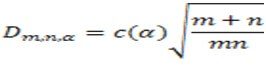
The d value is calculated and compared with the d alpha so that alpha is the probability of rejecting the null hypothesis. |
p-value:- |
It is calculated with the D and concludes the number is not uniform and p is large. |
Example:-
from scipy.stats.import kstest
import random
n=5
actual= []
print(“Enter outcome :”)
for i in range (N):
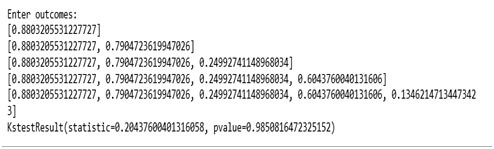
print(“Enter outcomes :”)
float i in range (N)
print(actual)
x=kstest (actual,”uniform”)
print(x)
Output:-
Applying K-S test for two samples on user data:-
The two samples of Kolmogorov is used to test and sample comes from the same distribution.
There is an example called the size m with cumulative distribution and F(x).
Then the second sample has size n,
The null is H0 has both samples from the population and the same distribution.
The Kolmogorv is test for normality and reject the null hypothesis
1. Mann-Whitney Test for Independent samples:-
The Mann-Whitney test is the non-parametric test and allows two groups to be compared without the assumption that values are distributed.
The test will require the two independent samples and data is continuous and scale the measurement of the ordinal and interval ratio.
There is maximum accuracy should be with no ties and has a way to handle the ties.
The Mann-Whitney has different a name as the Mann-Whitney-Wilcoxon, Wilcoxon.
The test is used to investigate that are independent samples and selected from the same distribution.
Syntax:-
Mannwhitneyu(a, b)
Where, a and b are the independent data samples.
Parameters |
x, yarray_like:-The array of the sample should be one dimensional. |
Returns |
Statisticfloat:-The function is equal to min and u for y. |
Example:-
Group.y=signed_rank (groups.y)
-‘p=scipy.stats.mannwhitneyu (data.y, data.y2)
Res=smf.ols (“y~1+group”, groups).fit ()
Utils.tabulate_results ([None, p, None, None, None], res, [“scipy.stats.mannwhitneyu”,”smf.ols(y~1+group, signed rank)”]), coeff=”group”)
|
value |
p-value |
t-value |
0.025 |
0.975 |
Scipy.stats.mannwhitneyu |
NaN |
0.05 |
NaN |
NaN |
NaN |
Smf.ols(y~1+group,signed rank) |
13.9 |
0.19 |
1.23 |
-7.4 |
35.2 |
Example:-
Import numpy as np
Import scipy.stats as stats
Group1=[1,5,7,3,5,8,34,1,3,5,200,3]
Group1=[10,18,11,12,15,19,9,17,1,22,9,8]
U_statistic, pval=stats.mannwhitneyu (group1, group2)
Print(‘p value :’)
Print(pVal)
Output:-
P value:-0.020
2. Wilcoxon Test for dependent samples:-
The wilcoxon tests is also called as the non parametric test which has the dependent t test and called as the wilcoxon t test.
The wilcoxon is also called as static value and has the T value.
The scipy.stats.wilcoxon () is also called as the calculation.
The requirements of the data are continuous and dependent variable.
For the best accuracy there should be no ties and test like others and has other way to handle ties.
Syntax:-
wilcoxon(a, b)
Where a, b are the two data samples
Example:-
Signed_rank_data=signed_rank (data)
-‘p=scipy.stats.wilcoxon (data.y)
Res=smf.ols (“y~1”, data=signed_rank_data).fit ()
Utils.tabulate_results([None,p,None,None,None]),res,[“scipy.stats.wilcoxon”,”smf.ols(y~1,signed)rank)”],coeff=”Intercept”)
|
value |
p-value |
t-value |
0.035CI |
0.975CI |
Scipy.stats.wilcoxon |
NaN |
0.03 |
NaN |
NaN |
NaN |
Smf.ols(y~1,signed rank) |
8.78 |
0.03 |
2.19 |
0.75 |
16.80 |
- Null hypothesis (H0):
Difference between the pair will follow a symmetric distribution around zero.
- Alternative hypothesis (HA):
The difference between the pairs will not follow a symmetric distribution around zero.
Wilcoxon signed-rank test:-
The wilcoxon is non parametric sample test and the data is not assumed to be normally distributed. It is used to determine sample which is equal to standard value. Some samples are not independent so Mann-Whitney is used and so the Wilcoxon rank test is used. The Wilcoxon test names as the students t test and the dependent samples. Fail to Reject H0:-The sample distribution is equal in the fail to reject. Reject H0:-In this the sample distribution is not equal.
Parameters:- |
X:-array_like is used to set the measurement nt. |
Returns |
T: It is float and sum of differences above and below zero. |
Example:-
From numpy.random import seed
From numpy.random import randn
From scipy.stats import wilcoxon
seed(1)
Data1=5*randn (100) +50
Data2=5*randn (100) +51
Stat, p=wilcoxon (data1, data2)
print(‘statastics=%3f’, p= %( stat, p))
Alpha=0.05
If p>alpha:
print(“same distribution (fail to reject H0)”)
else
print(“different distribution (fail to reject H0)”)
The dependent variable is measured in the ordinary and continuous scale and is drawn randomly and independently.
The Wilcoxon will test the null hypothesis and pair the sample with the same distribution.
Parameters:
Result: |
x: The array_like used to measure set. |
3) Kruskal-Wallis Test :-
The Kruskal test is non-parametric and used to determine the statistically significant difference between two or more groups and dependent on the variable.
The Kruskal test is also called the omnibus test and is a specific group of independent variables different from each other.
The quick start is to carry out with the Kruskal Wallis and report the result.
The data must meet Kruskal Wallis and give a valid result. Basically, data will come from the domains and obtain meaningful techniques.
The parametric approach is based on assumptions and distribution of the data and non-parametric data is based on weak assumptions and data.
The test is applied to find the independent samples and draw it from different populations.
The Kruskal-Wallis can be implemented using the Kruskal () scipy and take two or more data samples and return test statistics and p-value.
The example of gender has normal scale data as the male, female and hair color.
Fail to Reject H0: The samples as distribution are all equal.
Reject H0: one or more samples are not equal.
Parameters:- |
Sample1, sample2…array_like:- |
Returns:- |
nan_policy{'propagate’,’raise’,’omit’},optional |
Syntax:-
Kruskalwallis (GroupA, GroupB…GroupN)
Here, A, B are different groups
Example:-
data1=5*randn (100) +50
data1=5*randn (100) +50
data1=5*randn (100) +52
from numpy.random import seed
from numpy.random import randn
from scipy.stats import kruskal
seed(1)
data 1=5*randn (100) +50
data 2=5*randn (100) +50
data 3=5*randn (100) +52
Stat, p=kruskal (data1, data2, data3)
print(‘Statstics=%3f’, %( stat, p))
alpha=0.05
If p>alpha:
print(‘same distributions (fail to reject H0)’)
else
print(‘different distributions (fail to reject H0)’)
Output:-
statistics=6.05, p=0.04
Different distribution (reject H0)


