Types of Python parametric test Tutorial
In this tutorial, you will learn about parametric test and types of parametric test with example. The parametric test will assume parameters of population distribution. This method is a mean method and data samples have the Gaussian distribution. The tests are based on assumptions as there should be homogeneity of variance, depending on observation and sample drawn from population is normally distributed. In the machine learning application the data samples are compared and then one technique will perform better than the datasets.
The parametric statistical test will assume the data from the population distribution.
The p value is interpreted at the significant value so the p id denoted as follows,
P<=alpha: The null hypothesis is used and with different distribution.
p>alpha: It is used to reject the null hypothesis and the same distribution.
The two samples are drawn with the Gaussian distribution.
The randn () Numpy both the functions are used to generate a sample of Gaussian random numbers and mean is 0, the standard deviation is 1.
Normally distributed:-
The fraction of statics is depended on Gaussian distribution and used to drawn the data.
The gussian is used for the standard deviation technique and non Gaussian is used for the non parametric statistical method.
Example:-
if Data Is Gaussian:
Use parametric statistical methods
else:
Use non-parametric statistical methods
The main areas are as follows,
- The evaluation of the model in model selection.
- Residual evaluation in the model of the regression.
- The input data in case of the fitting models.
Methods are as follows:-
They are used for the quantitative evaluating and data look like the Gaussian.
The statistics will calculate the data and quantify how the data is drawn from Gaussian distribution.
Homogeneity of variance:-
The student’s test and ANOVA will require to compare have equal variance.
Testing the homogeneity is easy and functions depending on factors that are used.
The tests that are performed named as Levene’s and Fisher’s F test.
This test will check the homogeneity of variance and null hypothesis to show both variance are equal.
The function R is leveneTest(dataset-groups, data=dataframe)
Where,
- dataset is the dataset of the numeric data.
- Groups are vector which contain the names/labels of group.
- leveneTest () is in preinstalled package car in R.
Independent samples:-
The sample test is dependent on the variable that is continuous as in the ratio or interval.
The independent samples are present in groups and no group is influenced with the other group.
There are random samples of data and normal distribution is dependent on each group or heavily skewed.
Example:-
from scipy.stats import t
import numpy as np
import scipy.stats as stats
import seaborn as sns
import matplotlib.pyplot as plt
from statsmodel.stats import weightstats as statsmodelsweightstats
%matplotlib inline
The parameters are given as follows:-
Parameters |
a: The array_like is same observation. |
Returns |
Example:-
from numpy.random import seed
from numpy.random import seed
from numpy.random import randn
from numpy import mean
from numpy import std
seed(1)
data1=5*randn (100) +50
data2=5*randn (100) +51
print(‘data1: mean=%3f’ %( mean (data1), std (data1)))
print(‘data1: mean=%3f’ %( mean (data2), std (data2)))
Output:-
data1: mean=50.3 stdv=4.4
data2: mean=51.7 stdv=4.6
Use of the parametric statistical test:-
The parametric statistical test is performed with non normal distribution and skewed.
The importance of guidance should be followed to show the size of the data.
The test will perform well when the variance of each group is different and has statistical power.
One sample t-test:-
The one-sample test is used to compare the sample and standard mean.
The t-test is a member of the family and all tests will compare the differences in a mean score.
The independent or dependent test will work on the mean score.
This will compare the mean of sample to the predetermined value if the sample mean is greater or less than value.
Syntax:-
stats.ttest_1samp (sample, Val)
Where, the sample is denoted as a continuous variable for displaying the numeric vector or field from the data frame.
The value will represent which is needed to compare the sample mean.
Firstly we will see the t-test as it is mean of a vector against theoretical mean and formula is as follows,
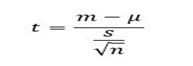
- m refers to the mean
- L to the theoretical means
- s is the standard deviation
- n the number of observations.
H0:-Null hypothesis and average is the same as the sample used.
H3:-The true hypothesis and its average are different from the sample that is used.
The t-test is commonly used in small sizes and performs t-test and syntax is as follows,
t.tset(x, y=NULL, mu=0, var.equal=FALSE)
set |
Null hypothesis |
Active hypothesis |
Number of tails |
1 |
μ = M |
μ ≠ M |
2 |
2 |
μ > M |
μ < M |
1 |
3 |
μ < M |
μ > M |
1 |
Arguments:
- x:-The vector used to compute one-sample t-test.
y:- The next vector used to compute two-sample t-test. - mu: It is the population and specifies whether the two vectors are equal.
The sample t test will give a sample is a statistically different manner or the hypothesis mean and it is called the parametric test.
There are test known as single tests and variables used are called test variables.
The student T-test is the name of the t-test in the python language.
They are different from one another and the t test will tell the difference.
The following shows formula for calculating t-test:-
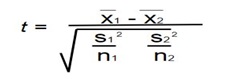
Where,
x̄1 - It the mean of the first data set
x̄2 - It is the mean of the second data set
S12 - It is the standard deviation of the first data set
S22 - It is the standard deviation of the second data set
N1 - It is the number of elements in the first data set
N2 - It is the number of elements in the second data set
T, p=scipy.stats.ttest_lsamp (data.y.0)
Res=smf.ols (formula=”y~1”, data=data).fit ()
Utils.tabulate_results ([None, p, t, None, None], res, [“scipy.stats.ttest_1samp”,”smf.ols(y~1)]”, coeff=”Intercept”)
|
value |
p-value |
t-value |
0.025CI |
0.9CI |
Scipy.stats.ttest_1samp |
NaN |
0.03 |
2.18 |
Nan |
Nan |
Smf.ols(y~1) |
0.3 |
0.03 |
2.17 |
0.03 |
0.5 |
Implementation of the t-test as follows,
Example3:-
#include<bits/stdc++.h>
floatMean(float arr [], int n)
{
for(int i=0; i<n; i++)
sum=sum+arr[i];
return sum/n;
}
float standardDeviation (float arr [], int n)
{
float sum=0;
for(int i=0; i<n; i++)
Sum=sum+ (arr[i]-Mean (arr, n))*(arr[i]-Mean (arr, n));
return sqrt (sum/ (n-1));
}
float tTest (float arr1 [], int n, float arr2 [], int m)
{
float mean1=Mean (arr1, n)
float mean2=Mean (arr2, m)
float sd1=standarDeviation (arr1, n)
float sd2=standarDeviation (arr1, m)
float t_test= (mean1-mean2)/sqrt ((sd1*sd1)/n+ (sd2*sd2)/m);
return t_test;
}
intmain()
{
float arr1[]={10,20,30,40,50};
int n=sizeof (arr1)/sizeof (arr1 [0]);
float arr2[]={1,29,46,78,99};
int m=sizeof (arr2)/sizeof (arr2 [0]);
count<<tTest (arr1, n, arr2, m);
return 0;
}
Output:-
-1.09
Applying t-test is on user’s data:-
Use of the test data and the assumptions are as follows,
The data should be continuous and observation should be randomly selected.
There are large sizes of samples and used in the normal distribution.
- Importing the libraries:-
import matplot
from math import pi
from math import *
- Creating a sample:-
list1= [1, 2, 3, 4, 5]
print(sample (list1, 3))
Output:-
[2, 3, 5]
Displaying details of sample:-
def personal_details ():
name, age=”seema”, 20
address=”katraj, Karnataka, pune”
print(“Name:{}\nAge:{}\nAddress:{}”.format(name,age,address))
Personal details ()
Output:-
Name: seema
Age: 20
Address: katraj, Karnataka, pune
Example:-
data<-read.csv (file. choose ())
dim(data)
head(data, 10)
qqnorm(data$screen_size.in.cm)
qqline(data$Screen_size.in.cm. col=”red”)
Output:-
[1]1000
Screen_size.in.cm.
1 10.6
2 10.8
Example:-
def personal_details ():
Name, age=”Pankaj”, 19
Address=”Hydrabad, karnataka, India”
Print(“Name:{}\nAge:{}\nAddress:{}.format(name,age,address)”)
Personal_details ()
Output:-
Name:-pankaj
Age:-19
Address:-Hydrabad, kanataka, India
Example:-
import numpy as np
from scipy_stats import kurtosis
from scipy.stats import skew
x=np.linespace (-5, 5, 1000) Y=1/ (np.sqrt (2.*np.pi))*.exp (-5*(x) **2)
print(‘excess kurtosis of normal distribution (should be0) :{}’.format (kurtosis(y)))
print(‘skewness of normal distribution (should be0) :{}’.format (skew(y))
Output:-
Excess kurtosis of normal distribution (should be 0):-0.
Independence sample test:-
The independent sample t-test will compare the means between the two groups and the same groups.
The samples are drawn independently and randomly also the variance between the groups is equal.
The sample test is determined by the expected population and means of the sample be different.
The data requirement is necessary for the independent sample t-test.
The variables are dependent on the continuous phase and the variable is categorical.
The random sample can be used on the other group and normal distribution is dependent on variables.
Parameters:- |
barray_like:-The arrays must have the same shape and dimension corresponding to an axis. |
Returns:- |
statsticalfloat:-It is calculated as the t statistic. |
Example:-
from scipy.stats import t
import numpy as np
import scipy.stats as stats
import seaborn as sns
import matplotlib.pyplot as plt
from statsmodels.stats import weightstats as statsmodelsweightstats
%matplotlib inline
sns.set_context (‘talk’)
sns.set_style (“darkgrid”)
Steps:-
- The setup of the experiment for two samples
- The alpha level is set to include the null hypothesis and alternative hypothesis.
- Then run the experiment and data is collected
- Calculate the critical value
- Comparing the t value and critical value
Applying t-test on the user’s data:-
The data used by kaggle.com are posted by web IR and dataset can be downloaded.
The data ser will contain the length and width of various variables
Example:-
From scipy import stats
np.random.seed (12345678)
rsv1=stats.norm.rvs (1oc=5, scale=10, size=500)
rsv2=stats.norm.rvs (1oc=5, scale=10, size=500)
stats.ttest_ind (rvs1, rvs2, equal_var=false)
Output:-
(0.268, 0.788)
Dependent t-test:-
The dependent sample t-test is also called the t-test and the test will be for significant difference between variables.
There are each sample and have a dependent variable that continues.
The test is checked randomly and each sample has a greater population.
Example:-
From scipy.stats import t
Import numpy as np
Import seaborn as sns
Import matplotlib.pyplot as plt
- One way ANOVA (Analysis of variance):-
The ANOVA is the analysis for the variance of one or more groups.
The ANOVA can be used to test and is used to compare the condition between 2+groups.
They will test if there is a difference in the mean and does not tell difference.
The independent sample for comparing in the situation and there are two groups.
The assumptions are given as follows:-
- The independent variable that should be two or more than the groups.
- There are different participants with more than one group.
- It is the dependent variable and is normally distributed for each category.
One way ANOVA:-
The identity between the scipy and ANOVA function dummy coded with smf.ols.
Example:-
f, p=scipy.stats.f_oneway (a, b, c)
Res=smf.ols (“y~1+group_b+group_c, df).fit ()
Table=pd.DataFrame (index= [“F statistics”,”p value,”df”])
Table[“scipy.stats.f_oneway”] = [“F, p, none]
Table[“ols (y~1+group_b+group_c)”] = [res.fvalue, res.f_pvalue, res.df_model]
Table.T
Scipy.stats.f_oneway |
F-statistics |
P value |
df |
|
121.8 |
2.63e-21 |
NaN |
Ols(y~1+group_b+group_c) |
121.8 |
2.63e-21 |
2.0 |
Example:-
import pandas as pd
import scipy.stats as stats
import researchpy as rp
import statsmodels.api as sm
Success!
from statmodels.formula.api import ols
import matplotlib.pyplot as plt
df=pd.read_csv (“https://raw.githubusercontent.com/Opensourcefordatascience/Data-sets/master/difficile.csv”)
df.drop (‘person’, axis=1, inplace=True)
df[‘dose’].replace ({1:’placebo’, 2:’low’, 3:’high’}, inplace=True)
rp.summary_cont (df [‘libido’]
Two ways ANOVA:-
The scipy.stats will perform two ways ANOVA and cannot be demonstrated.
Example:-
Res=smf.ols (“y~1+group*mood”, df).fit()


